01 / 14
Showcase · 2026

Operational visibility in real time.

How field data, cloud and analytics turn into traceability, visibility and action in a global, high-stakes operation.

14 chapters · ~18 min
Scroll
The challenge

A global operation, complex and high-risk.

A Fortune 500 upstream energy company and a global leader in oilfield services: well construction, completions, stimulation, subsea and production optimization, onshore and offshore, down to deepwater. Remote environments, intermittent connectivity, thousands of assets on the move and tens of thousands of people keeping the operation running 24/7.

120+
Countries
$36B
Annual revenue
200k+
Assets tracked
10k+
People in the operation
24/7
Continuous operation
US · CA · AR · MX · BR · DZ · SA · AE · RU · CN · AU · ZA
The operational context

A continuous ecosystem that runs 24/7.

Every fracking site is one integrated operation: people, materials and information in sync around the clock to keep production, safety and cost under control.
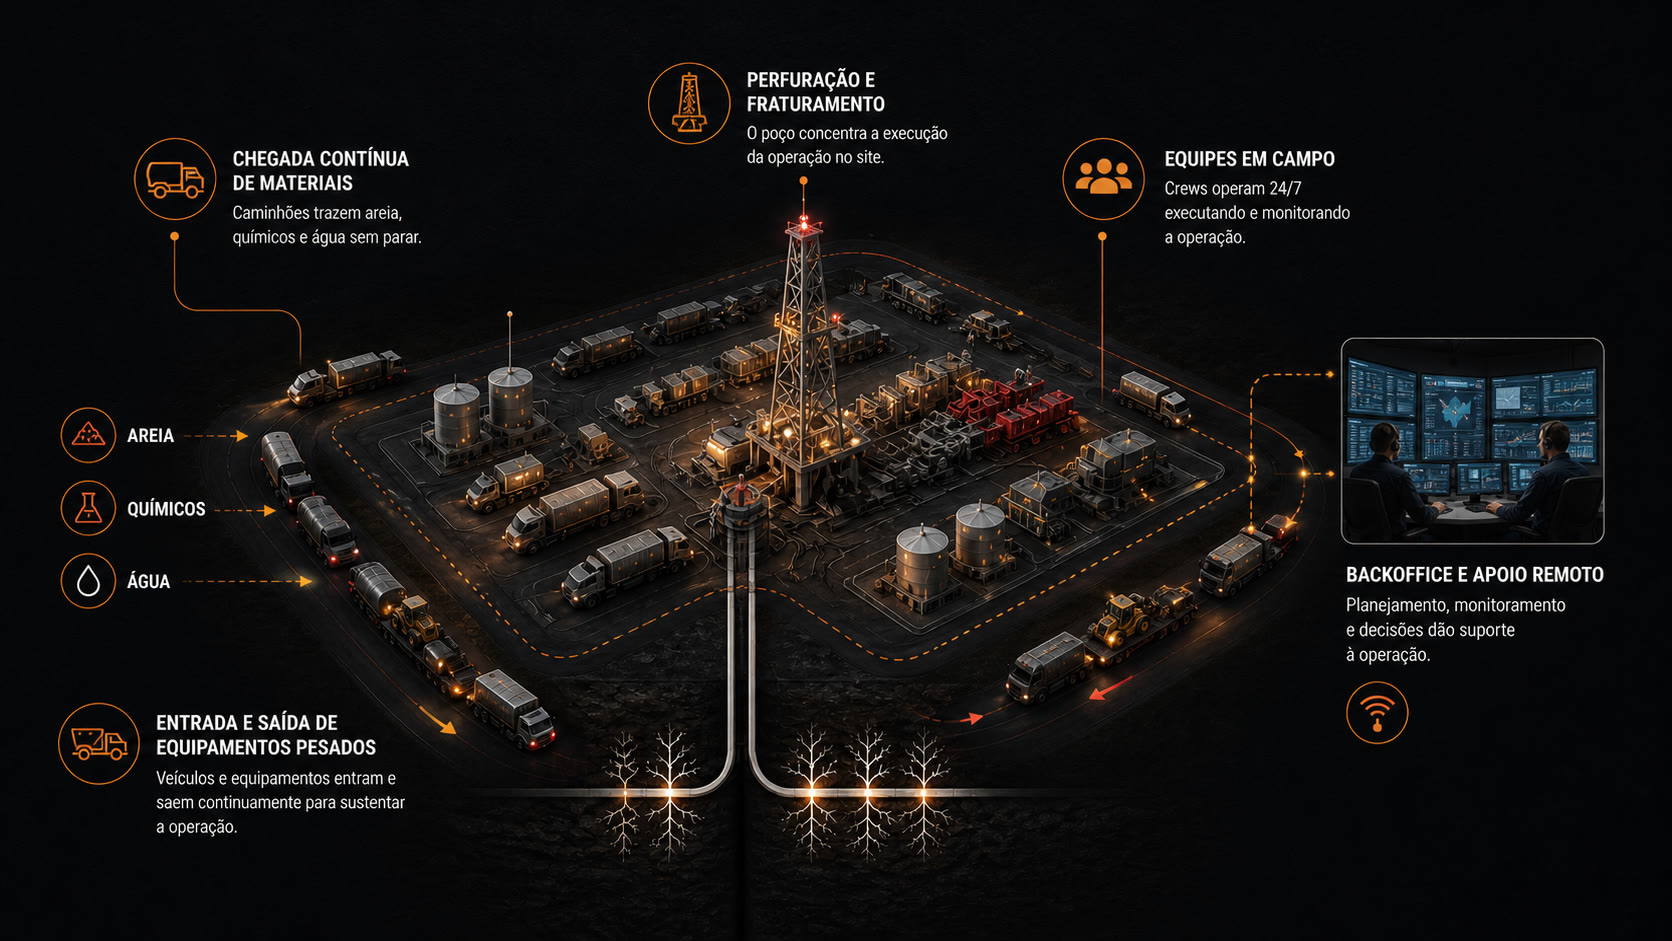
Fracking site: drilling, materials, crews in the field and the remote back office
01Crews

Field crews run the operation on site, in shifts, 24 hours a day.

  • Technicians and operators
  • Equipment maintenance
  • Field monitoring
  • Safety and quality
02Materials

A continuous flow of raw material arriving and being consumed.

  • Sand (proppant)
  • Chemicals
  • Water
  • Fuel and supplies
03Back office

Support teams keeping resources available, the operation efficient and compliance on track.

  • Delivery planning
  • Operation monitoring
  • Analysis and alerts
  • Exception management
Where it hurt

Three classes of problem. One root cause.

The data existed. It just wasn't reaching the right place, at the right time, in the right shape, for the people who had to decide.

01

Asset visibility and tracking

Hundreds of heavy assets: pumps, blenders, sand silos, water tanks, frac vans, moving in, out and between sites. A different mix of systems and providers in every region, with no unified view of where anything is.

4 systems10+ GPS providers3-day audit
02

Supply delivery logistics

Sand, water and chemicals arriving in a continuous flow. If the sand doesn't land on time, production stops. Dispatch ran on spreadsheets and phone calls: no real-time tracking, no auto-matching, no demurrage visibility.

Sand-out = downtimeManual dispatchExcess inventory
03

Field activity logging

Crews logged stages, pressures and critical events in spreadsheets, out in the field, wearing gloves, with no signal. Data that feeds customer billing, compliance and the coordination between field and control center.

Stage eventsCustomer billingSync hours later
“The three problems shared one root cause: the operation needed an orchestration layer that could connect data, decision and action.”
The solution, in one sentence

A digital layer over the existing systems that captures, integrates, organizes and activates operational data.

captureintegrationnormalizationgovernanceanalyticsMLsmart appsalerts

An architecture that connects field apps, legacy systems, sensors and events into a single, reliable source of operational truth, running on top of the systems already in place.

Layer 01

Every asset in a single view.

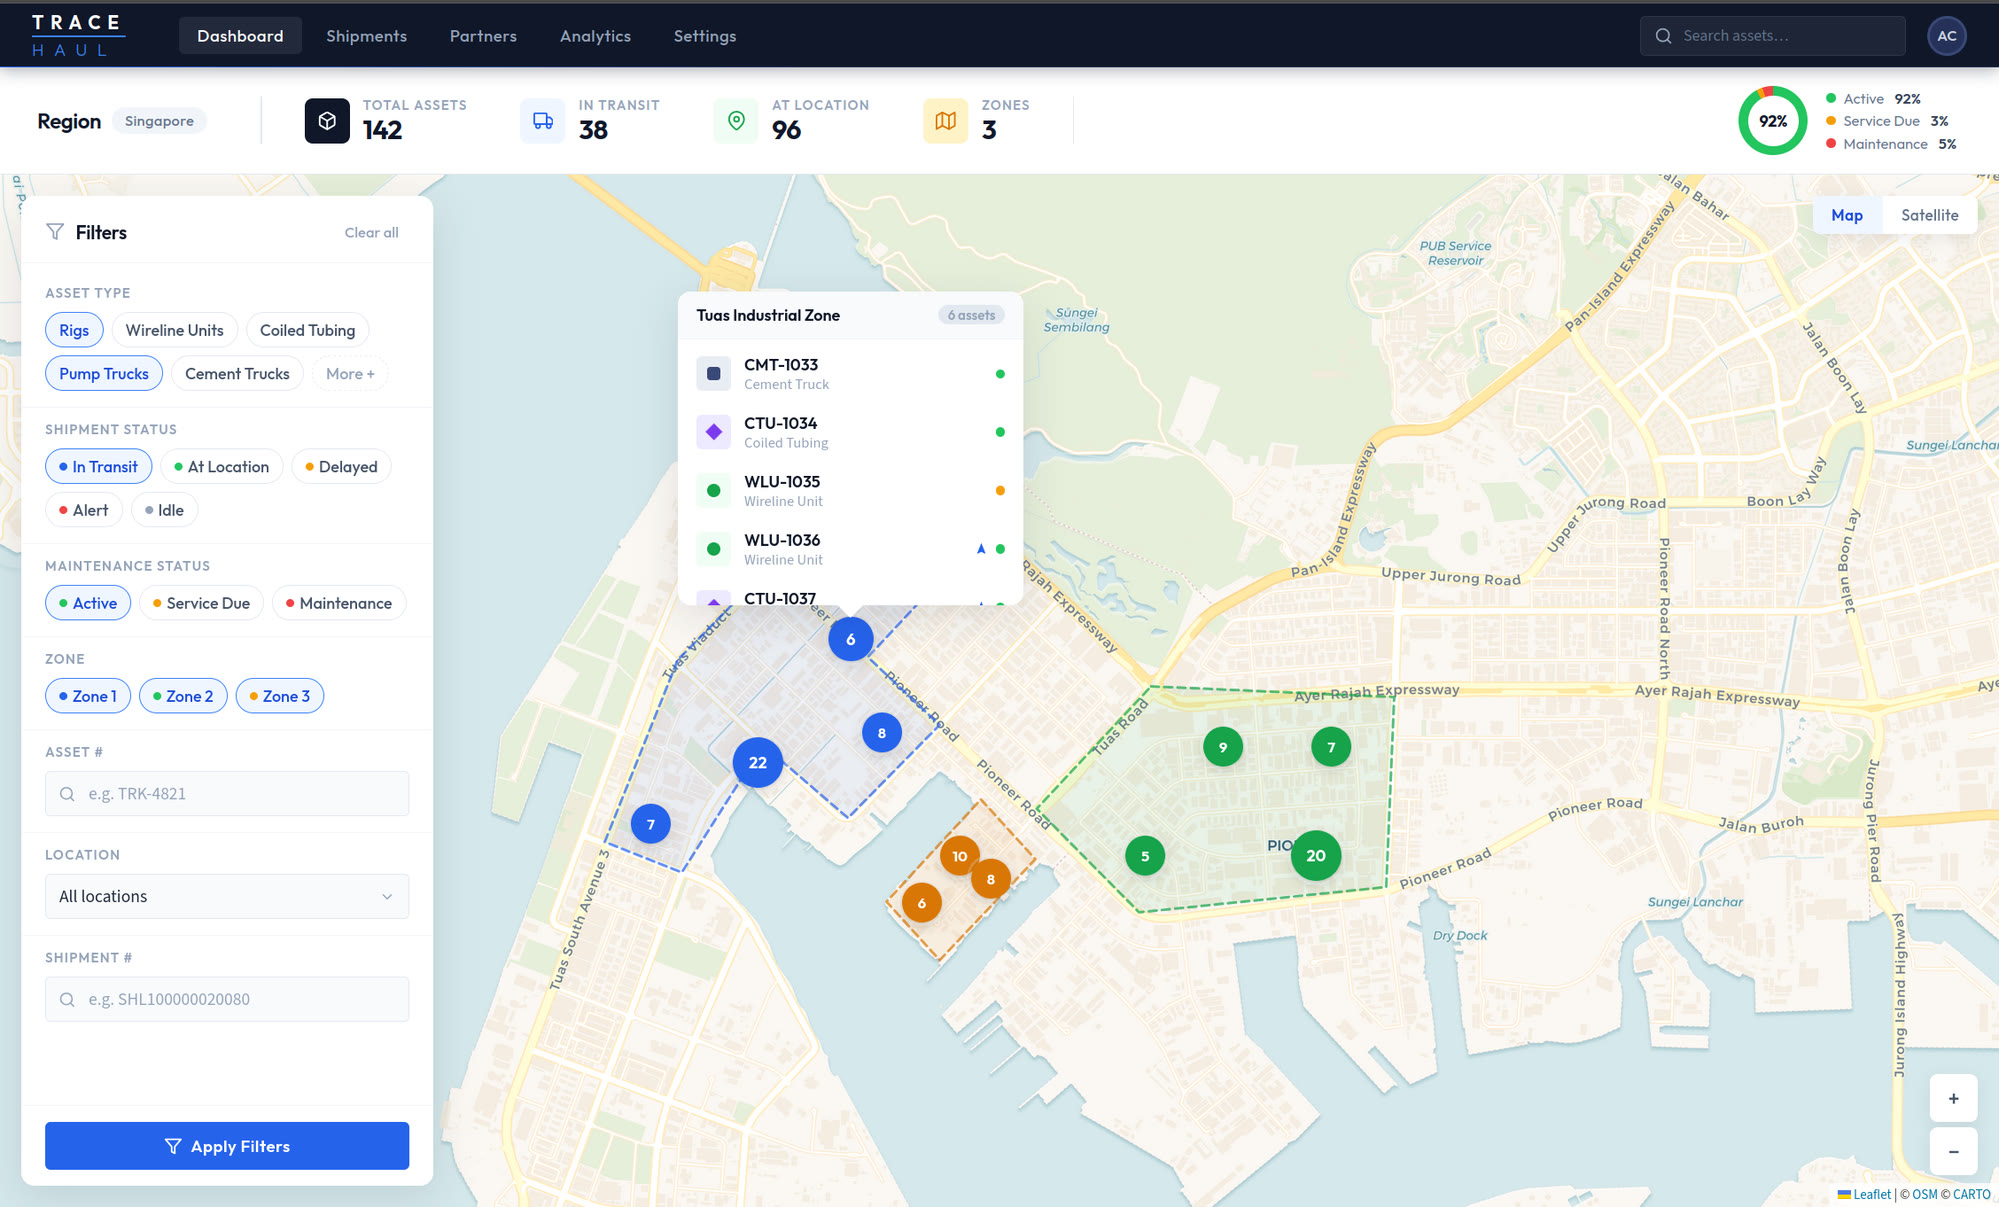
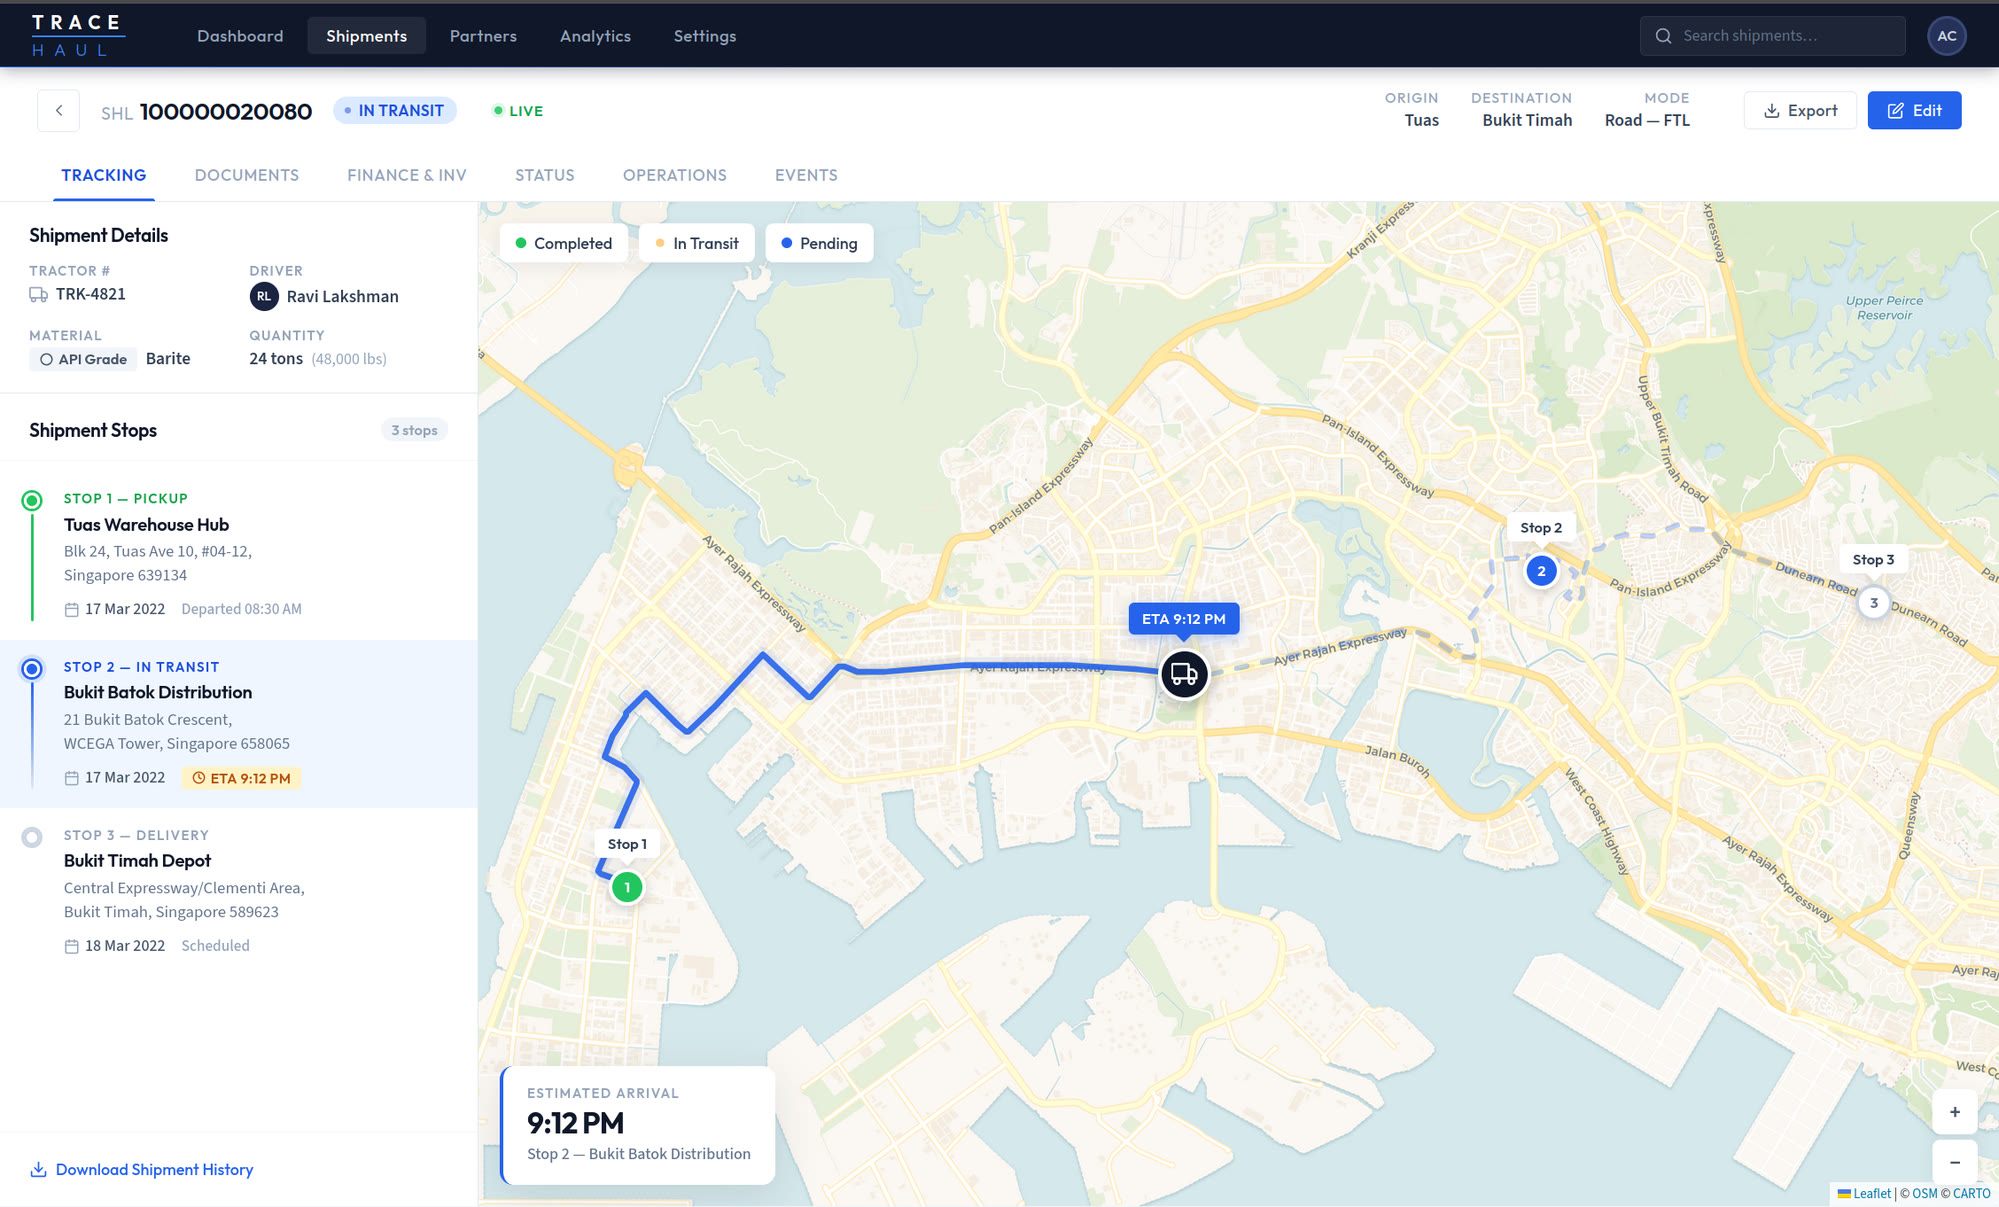
Asset-tracking dashboardDelivery-tracking dashboard
01

Asset visibility and tracking

A unified asset map with RFID, QR Code and GPS tracking. Result: inventory audits done in 15 minutes, with no manual consolidation.

RFIDQR CodeGPSGeofencing
BigQuery · Cloud Storage · Pub/Sub
Layer 02

Dispatch had outgrown the spreadsheet.
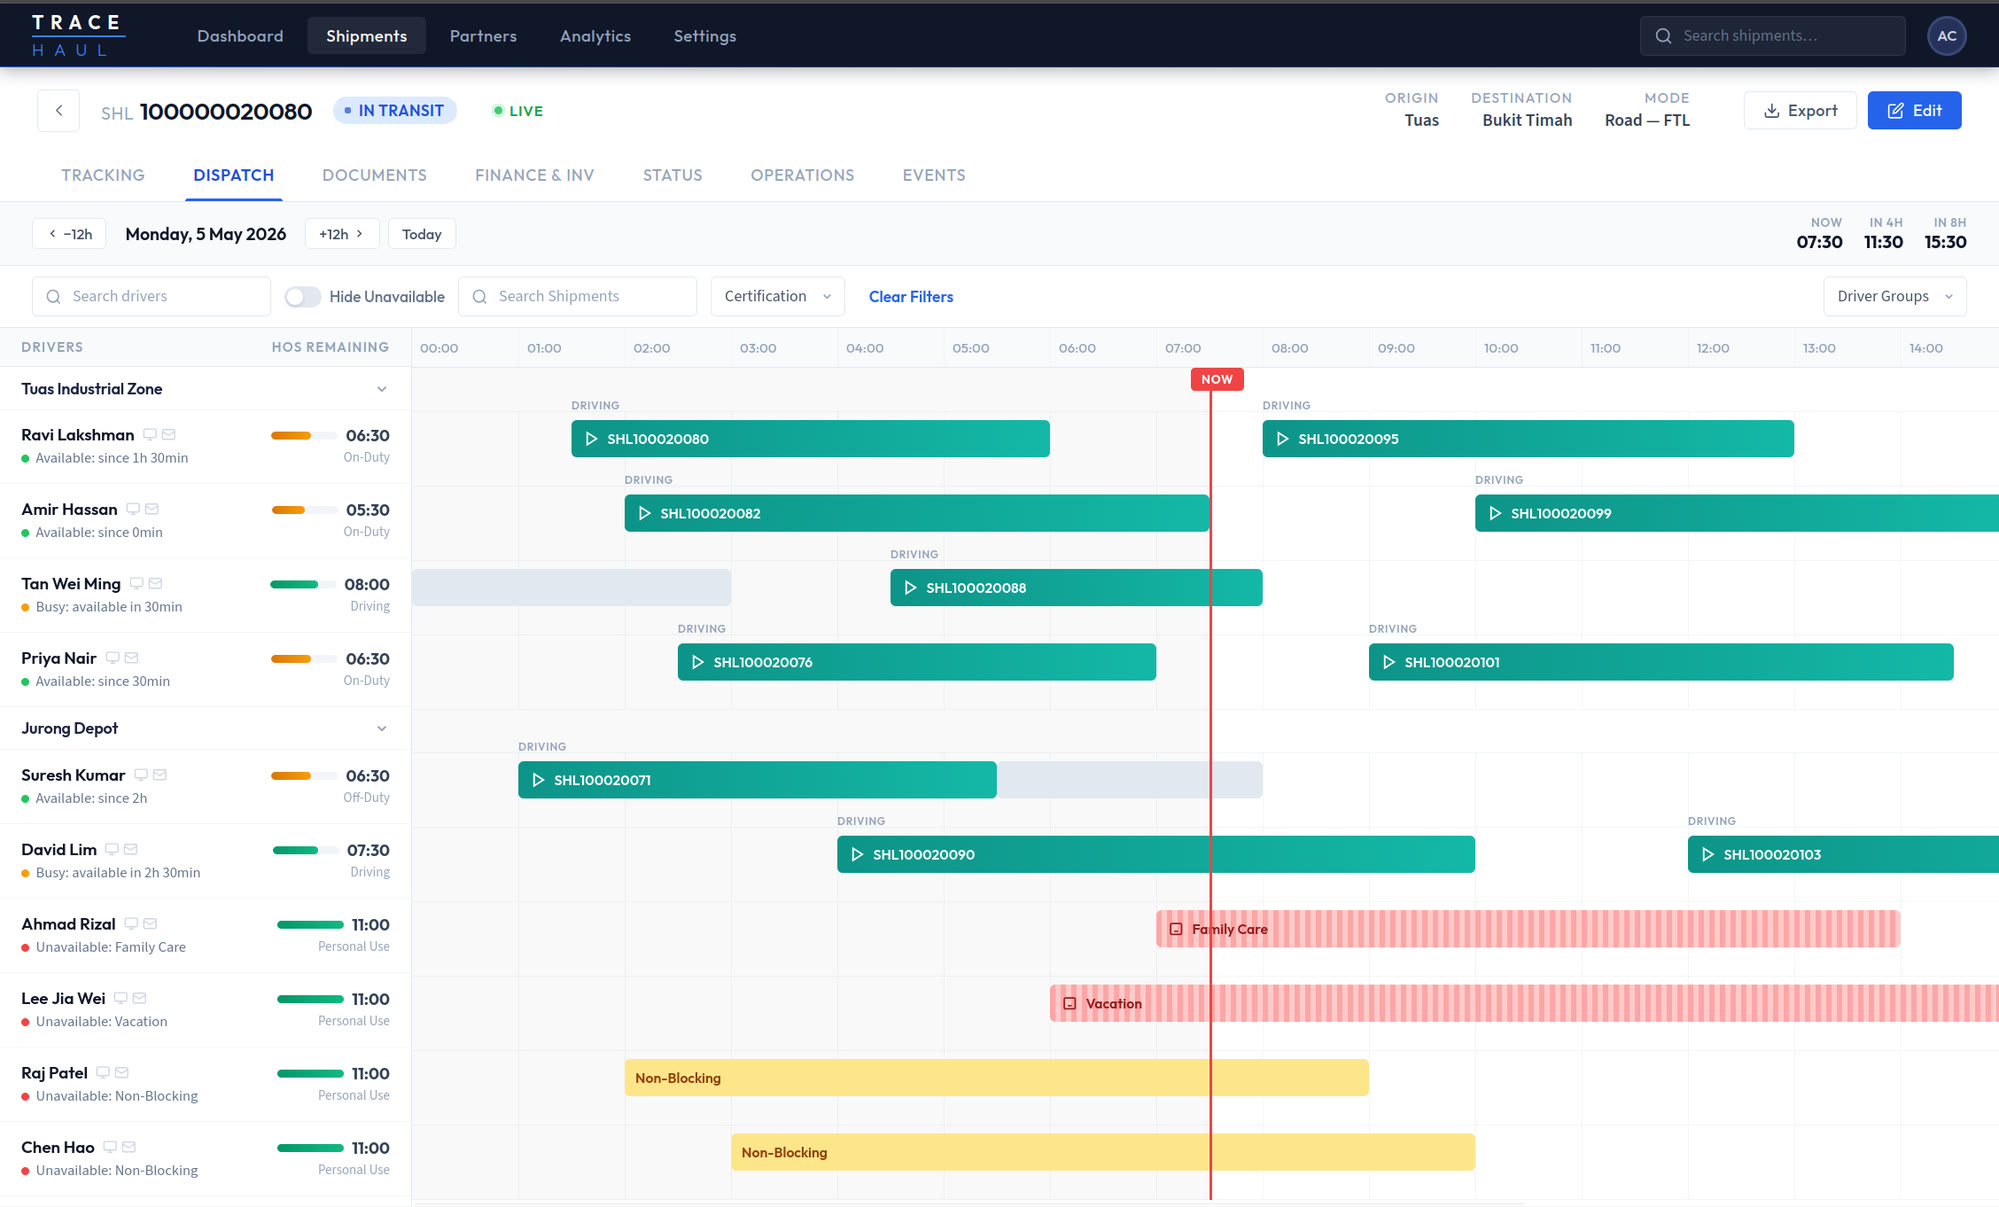
Logistics dispatch dashboard
02

Supply delivery logistics

Real-time tracking, geofencing per well and automatic vehicle-to-demand matching. Result: 100% of deliveries tracked.

Real-timeGeofencingAuto-matchingETAs
Pub/Sub · Cloud Run · Dataflow
Layer 03

Data that starts where the work happens.
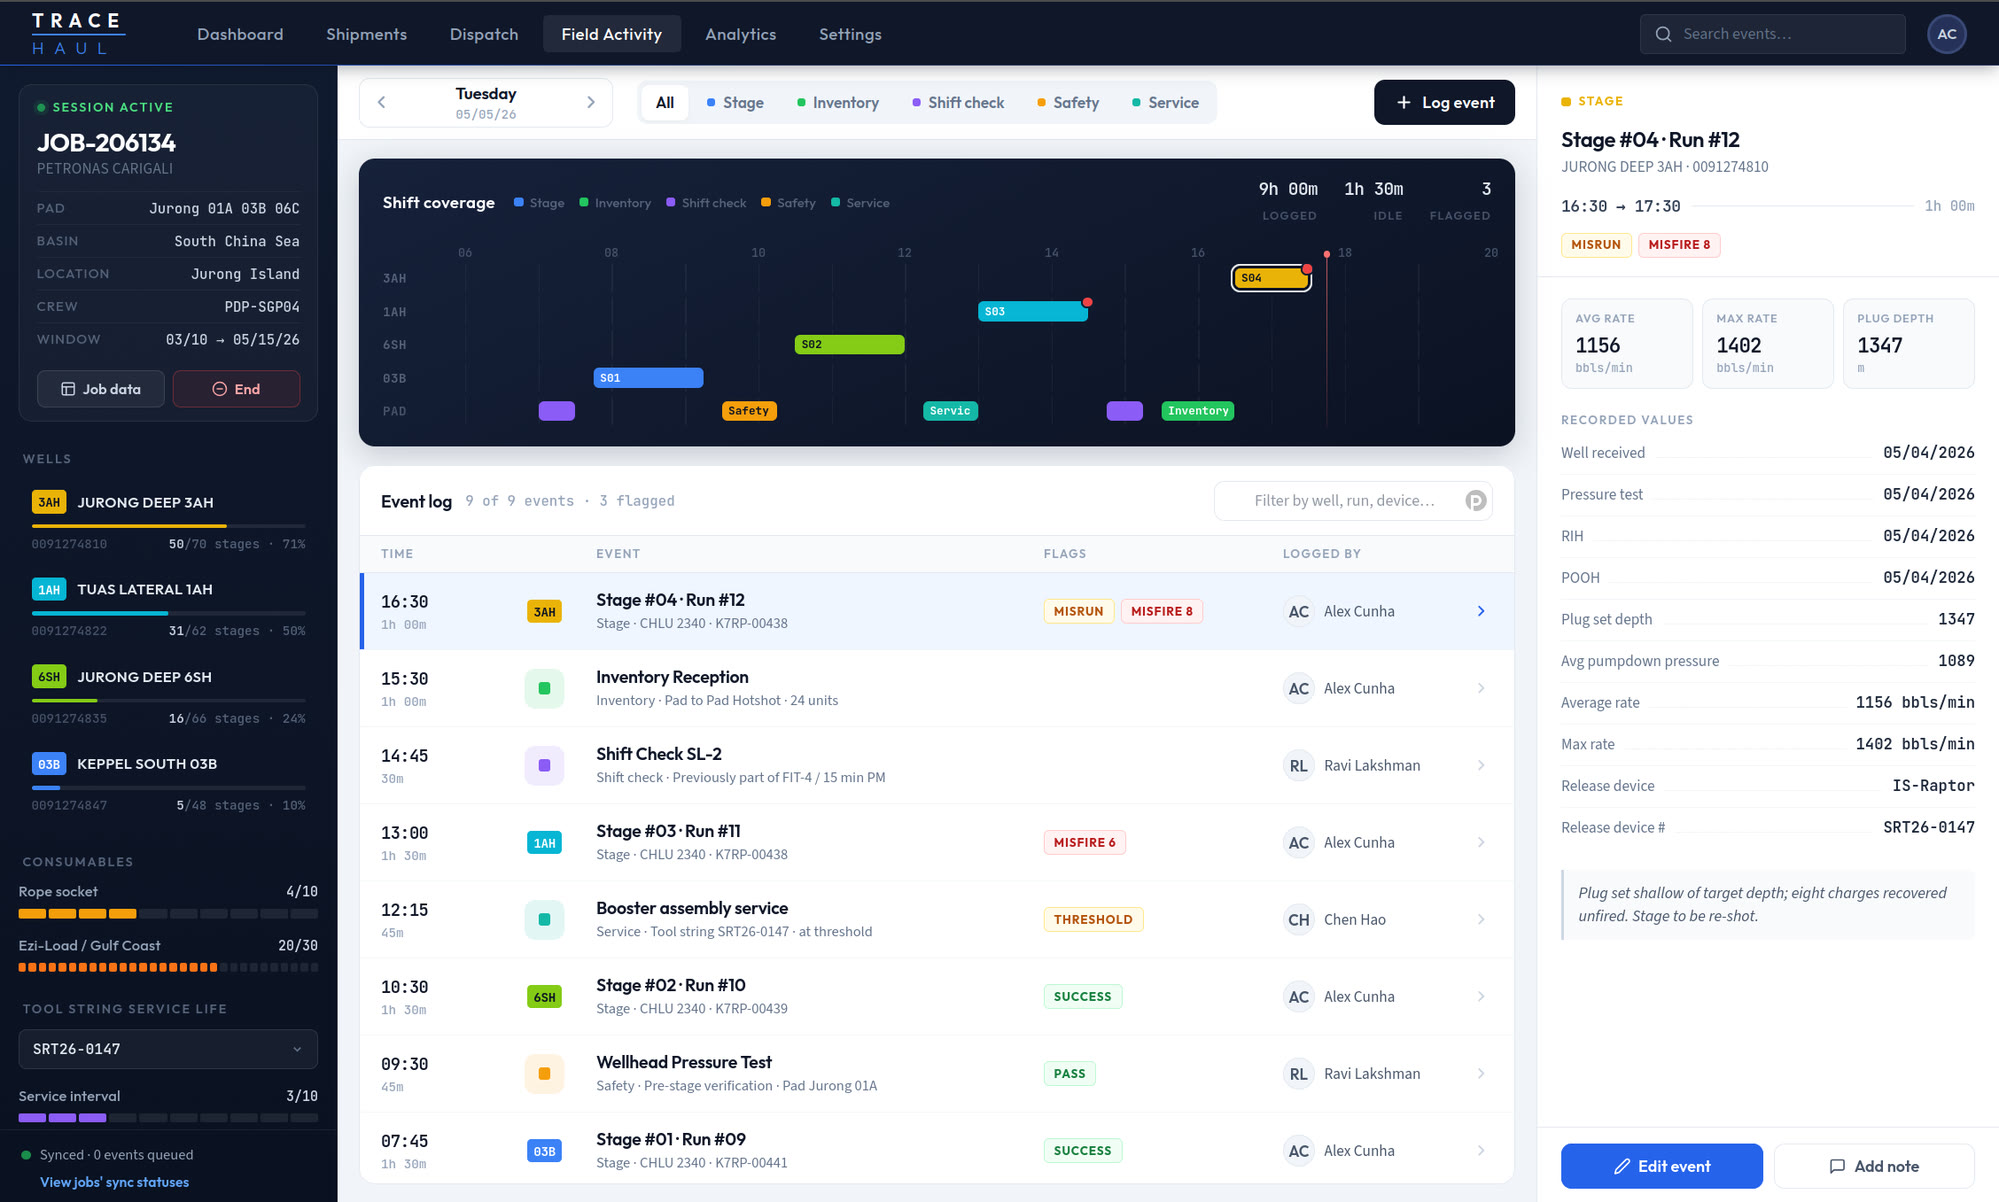
Field activity console: job session, event log and stage detail
03

Field activity capture

Real-time capture in the field, on an offline-first app with automatic sync. Result: 5× faster sync and 100% data consistency.

Offline-firstAuto-syncPhoto + GPSVoice notes
Cloud Functions · Storage · Vertex AI
Solution architecture

From field to decision.

01Sources
Field · sensors · systems

Field apps · GPS / RFID / QR · ERP / TMS / CRM · IoT sensors

02IngestionPub/Sub
03Data PlatformBigQuery
04IntelligenceVertex AI
05Action
Dashboards · apps · alerts

Executive dashboards · Smart apps · Real-time alerts · Mobile UIs

Google Cloud provides the foundation of scale, data and intelligence. ZBRA turns that foundation into the client's real operation.

Solution architecture

From field to decision.

01Sources
Field · sensors · systems
Field apps
GPS / RFID / QR
ERP / TMS / CRM
IoT sensors
02Ingestion
Pub/Sub
Cloud Functions
Cloud Run
Connectors
03Data Platform
BigQuery
Cloud Storage
Dataflow
Dataform
04Intelligence
Vertex AI
Predictive ETAs
Anomaly detection
Looker
05Action
Dashboards · apps · alerts
Executive dashboards
Smart apps
Real-time alerts
Mobile UIs

Google Cloud provides the technological foundation for scale, data and intelligence. ZBRA turns that foundation into operational solutions that work in the client's real context.

From extraction to reliable data

Data integrity is what holds the model up.

Before predicting, alerting or recommending, you have to ensure the data is traceable, comparable and correct. That's the quiet work that makes all the intelligence possible.

Stage 1
Extraction

APIs, field apps, queues, connectors, sensors and events.

Stage 2
Normalization

Common schemas, units, time zone, taxonomy.

Stage 3
Validation

Quality, completeness, deduplication, business rules.

Stage 4
Correlation

Events correlated by cycle: delivery ↔ route ↔ well ↔ shift.

Stage 5
Serving

Served to analytics, dashboards, ML and smart apps.

100%
operational consistency
5×
faster sync
98%
visibility accuracy
<1 min
average asset update
Intelligence layer

With the foundation ready, agentic AI steps in.

With the operational data in shape, autonomous agents work alongside ML and analytics: they monitor the operation, read the context, suggest dispatch, anticipate stoppages and run triage.

AI Agent · Operations copilot
Natural-language Q&A about the operation
AI Agent · Autonomous dispatch
Reallocates trucks and crews in real time
AI Agent · Incident triage
Diagnosis + proposed action plan
ML · Predictive maintenance
Anticipates failures in critical assets
ML · Anomaly detection
Pressures, routes, off-pattern events
Analytics · Continuous optimization
ETAs, dispatch, resource allocation
ops.zbra.dev / agents · live8 agents
Auto-resolved · 24h
47
+12
Agent uptime
99.8%
live
Anomalies · 24h
23
−38%
Ops Agent · live14 sites · 3 shifts
Which assets are at risk in the next 6h?
Found 3 assets at risk in the next 6 hours:
RIG-08Csand-out forecast 14:00P 87%
RIG-04Apressure drift +2.3σP 64%
T-117off planned routeP 52%
Reallocate trucksView plan2.1s · 4 sources
Agent activity · 24h
autonomous
DISPATCHReallocated 4 trucks · zone B → D8m
MAINTENANCEScheduled inspection · pumps RIG-04 & 1221m
TRIAGEPressure anomaly · escalated to lead47m
Results

What changes when the data shows up on time.

Every number below is a decision that only became possible because the information arrived tracked and in real time.

Asset traceability
99%
reduction in audit timefrom 3 days to 15 minutes
150k+
assets under one unified viewon a single platform
1 min
average updatenear real time
Field logistics
45%
fewer stoppages from supply shortagesproduction kept running
90%
fewer reroutesroutes planned and followed
100%
deliveries trackedin real time
Field operations
35%
less downtimea more stable operation
65%
more crew efficiencyless rework
5×
faster data syncfield → control center
“The operation started deciding on reliable, fast data, close to where events actually happen.”
A replicable capability

A capability we can rebuild for any operation.

What changes from client to client are the data sources, the process and the indicators. What doesn't change is the path: capture the information at the source, move it to the cloud and turn it into decisions.

Integrate fragmented systems

ERP, TMS, CRM, sensors, GPS, spreadsheets. The layer connects what exists without replacing it.

Capture data in the field

Offline-first apps designed for the real environment: gloves, cold and no signal.

Operate in the cloud

Ingestion, normalization, governance and analytics on a scalable platform.

Real-time visibility

Dashboards, maps, delivery status and alerts.

Applied intelligence

Predictions, anomalies and prioritization.

Operational result

Less downtime, less demurrage, more scale. Metric before model.

Applicable sectors: energy, logistics, mining, agribusiness, heavy industry, biotech, healthcare and manufacturing. Any operation where data starts in the field, lives in separate systems and has to become decisions fast.

Summary

Every decision starts with data that shows up on time.

We build the layer that connects field, cloud and action in any operation.

Talk to ZBRA